
READING PRICE ACTION


Reading price action is the art and science of trading by understanding the interaction of buyers and sellers as measured by prices on a chart. Many pure price action traders remove all technical indicators from their charts and trade price alone. Some consider price action trading the purest form of technical trading and technical indicators as just derivatives of price. Many traders prefer to use price action alone for their trading decisions. 

Reading the price action on a chart can allow a trader to see several things.

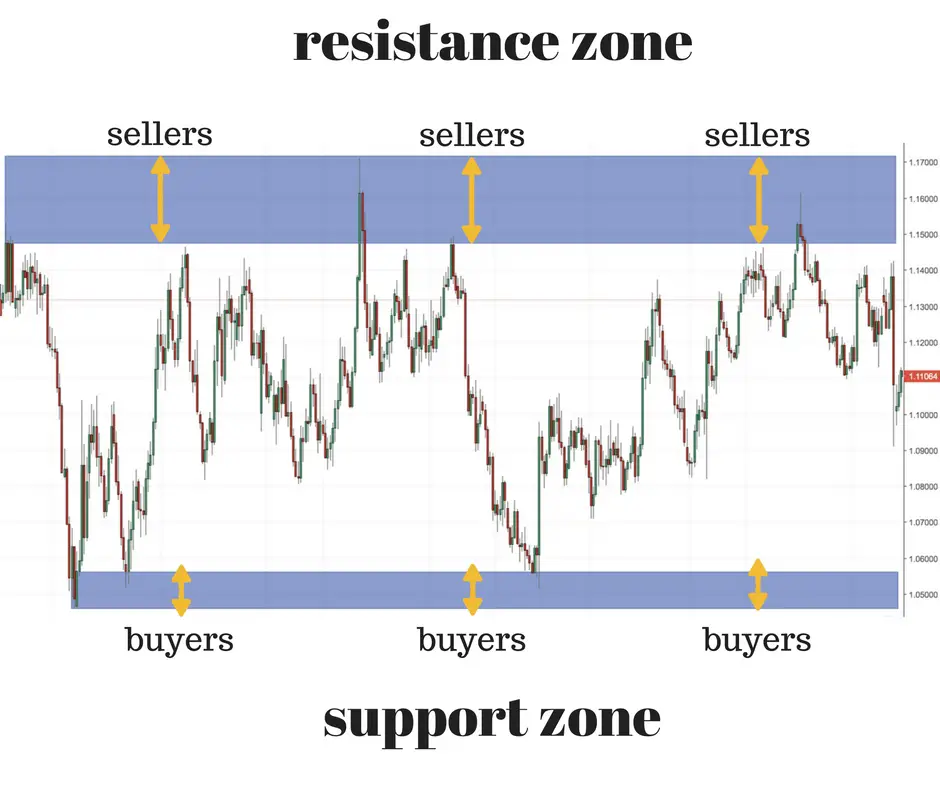
  • Key price levels of price support. 
  • Key price levels of price resistance. 

supply and demand zones

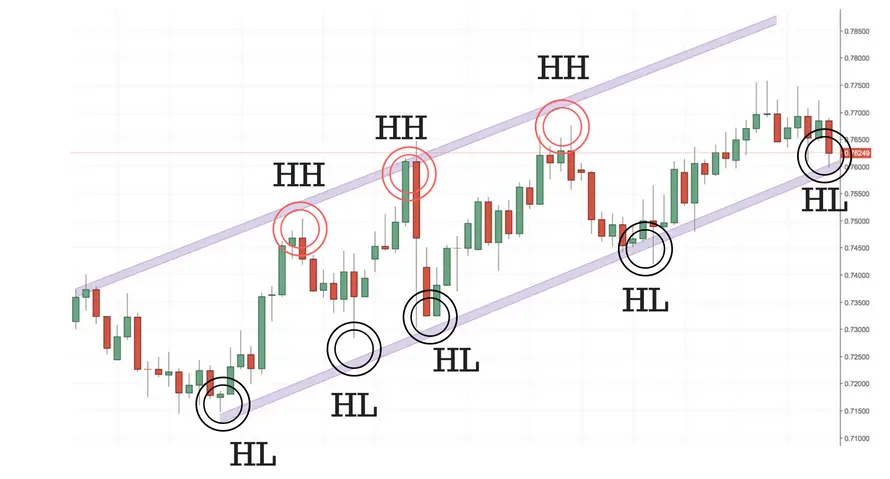
  • Higher highs and higher lows defining an uptrend.

Trending chart

  • Lower highs and lower lows defining a downtrend. 

Downtrending chart

Trend lines are used to define the vertical and horizontal support and resistance areas for price action on a chart. Many chart patterns are built by looking at price action and defining a breakout from these zones. 

chart patterns cheat sheet
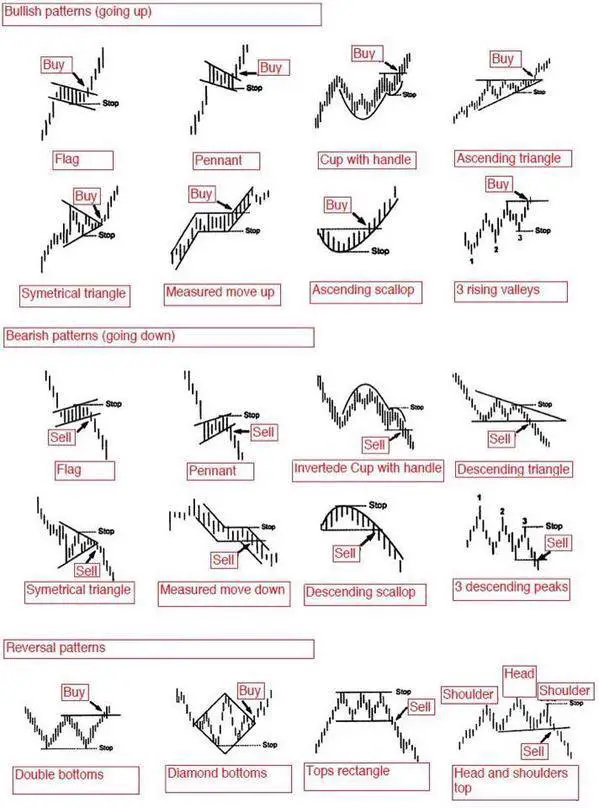
Chart patterns can signal breakouts, reversals, and continuations by reading price action support and resistance zones. 

Price action can be read on charts from all time frames from minute charts for day trading to monthly charts for long term position traders. Some scalpers and day traders read price action on level 2 quotes to see the direct interaction between bid and ask prices in real time. 

Many trend followers create reactive trading systems from price action alone. An example could be buying a new 20 day high in price and selling it when price makes a new 10 day low in price looking to create big wins and small losse


  • The Turtles traded a breakout system. System 1 entered a 20 day breakout and exited at a 10 day breakout in the opposite direction of the entry.
  • System 2 entered a 55 day breakout and exited at 20 day breakout in the opposite direction of the entry.
  • No trade could incur more than a 2% equity risk, stop losses were planned accordingly.
  • Darbar  was one of the first to read price action to make millions trading uptrends. Darvas’ system would look for stocks making new all time highs on increasing volume. He would quantify trading ranges of price support and resistance highs to draw a box around. A breakout above the high prices would signal for him a new buy entry point and a breakdown below the low in a Darvas box price would trigger a stop loss and signal for him to exit the trade. His Darvas Box strategy told him to hold his position as long as price didn’t drop and stay back in the previous price range box. A price breakout would signal a new possible support level are to watch for the next box if price stair stepped upwards. Nicolas Darvas was a pure price action trader and used no technical indicators, just price alone. 
Nicolas Darvas Box Theory

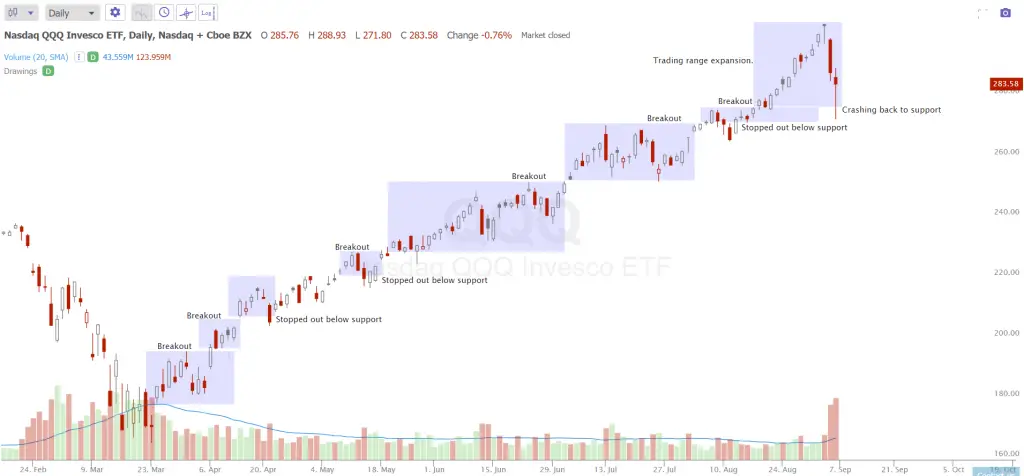
Chart courtesy of TrendSpider.com

Many legendary traders used pure price action trading systems at times to simply follow to path of least resistance of buyers and sellers.

Comments

Popular posts from this blog

STOCK CHART PATTERNS

  Stock chart patterns   are simply a visual representation of the prices buyers and sellers bought and sold at in the past. There is no magic in a chart pattern they just show you what happened in the past and what has a higher probability of happening in the future. The best use of chart patterns is to take a wider view of the trend on your time frame of choice and follow the path of least resistance.  A chart pattern can show that a stock is in a range with defined resistance and support. A chart could also show an uptrend of higher highs and higher lows or a downtrend of lower highs and lower lows. Stock chart patterns signal whether a stock is under accumulation or distribution or just trading in a defined price range.  The most popular use of stock chart patterns is for breakout trading signals as the probability increases of a move in a specific direction after a price breakout of a previous support or resistance. They are basically momentum indicators. The va...

Stock Screener Settings for Top Growth Stocks

  One of the best stock screening filters for finding growth stocks are the parameters of the CAN SLIM Investing System that was created by William J. O’Neil. These parameters were quantified by his study of the fundamental company metrics of the largest winning stocks in the history of the U.S. stock market going back over 130 years. The stocks that historically met these guidelines were the ones that eventually created the majority of the Alpha in the stock market over the long term during bull market cycles. He looked for the fundamentals that companies in the first stages of big growth cycles possesed.  The CAN SLIM Investing System looks for specific fundamental measurements of a company’s strength of earnings and sales along with its growth rate. It also considers more discretionary company filters like innovative products or business models along with good management.  A CAN SLIM fundamental filter is a great place to start if you are looking to build a w...

Pre Market Report, Jan 29, 2021

  US markets closed higher. But it has given up half of the gains in last hour. Asian markets are mostly positive. SGX Nifty crossed 14050 yesterday night but now trading around 13970. Still this will be a gap up of more than 100 points. Nifty has fallen more than 1000 points intra month in Jan series. Bank Nifty has fallen more than 3000 points intra month in Jan series. Last month FIIs began with more than 75% long in F&O. This month it is only 62%. Markets are light going in to budget. Decissive direction will be set only after budget. For very short term, 50DMA of 13700 is a good support. Yesterday markets took support near 13700. Pharma stocks will be in focus as many pharma stocks will declare results. Moreover when overall markets are weak, pharma and FMCG tend to do well. Whenever huge selling happens in bluest of blue chip stocks like HDFC Bank and HDFC, the bottom is somewhere near. Yesterday I could feel that, at the same time, markets may not rally from here. Market...